
Overview
The Time Analysis plugin in ONE TIMING displays the fastest sector, lap, and theoretical best lap times in a clear table format. This is particularly valuable during Qualifying Sessions to quickly identify where drivers have the most room for improvement. By default, only your selected Manufacturer is highlighted, with all times shown in absolute values.

Car Selection
The sidebar offers robust tools for managing which cars are displayed in the analysis. Please see here 📎 to get more information.
Values View
- Table Display: Shows top sector, lap, and theoretical best lap times for all selected cars.
- Highlighting: By default, only your selected Manufacturer is highlighted.
- Absolute Values: All times are displayed as absolute values unless you enable percentage or delta views.
- If you are interested in Loop Times, you may want to use the Time Loop Analysis plugin here 📎.
Customization & Preferences
- Coloring: Choose whether all cars are colored or just the highlighted Manufacturer in Preferences.
- Delta View: Display the difference (delta) from the fastest car as a reference for each column.
- Reference Driver: Select a specific driver to calculate deltas based on their performance.
Invalidated or Canceled Laps
Any laps or sectors that have been invalidated or canceled within ONE TIMING will not be displayed in this plugin. Users also have the option to view times as percentages, with the fastest car set at 100% for each column, or the selected reference car if applicable.
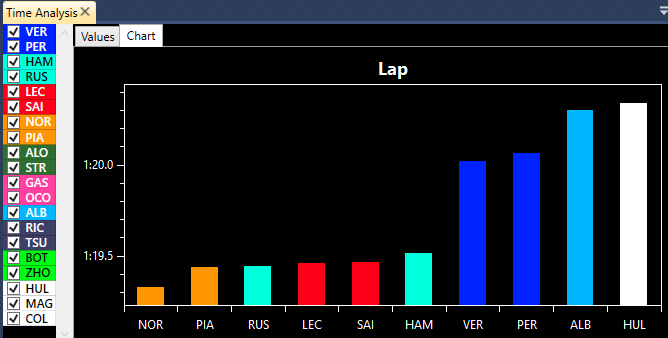
Chart View
The Chart View can be accessed through the second tab of this plugin.
- Column Selection: Use the context menu to choose which sector, lap, or theoretical lap time to display.
- Manufacturer Focus: Optionally show only the fastest car from each manufacturer.
- Flexible Visualization: Select which sectors, lap times, or theoretical lap times to display. In Manufacturer view, the fastest car from each Manufacturer is highlighted.
Context Menu Options
Within the Values view, users have access to a variety of options through the context menu:
- Show Percentages: Convert times into percentage values.
- Color All Cars: Color all cars based on Preferences, or maintain a dark background while highlighting only the selected Manufacturer. If the Manufacturer is not present in the session, ONE TIMING will highlight the selected Team instead.
- Show Delta: Show the difference from the reference (applies to both times and percentages).
- Power Modes: For Formula E, distinguish laps completed with varying power modes for deeper analysis.
- Show Manufacturers: Only the quickest car from each manufacturer is shown in every column.
- Show Vertical Scrollbar: Prevent overcrowding by activating the vertical scrollbar if there are too many cars for the plugin’s vertical size.
Reference Driver & Data Export
- Reference Driver: Choose the driver that will serve as the reference for displaying all times relative to this car. If you select a driver who did not set any times in the session, you may encounter display issues.
- Copy All Data to Clipboard: Effortlessly transfer table data into Excel or any location on your computer using the copy to clipboard feature.
Example Table
| Sector 1 | Sector 2 | Sector 3 | Lap | Theory Lap |
|---|---|---|---|---|
| SAI 26.223 | NOR 26.579 | NOR 26.253 | NOR 1:19.327 | NOR 1:19.232 |
| RUS 26.296 | PIA 26.643 | RUS 26.300 | PIA 1:19.436 | RUS 1:19.432 |
| LEC 26.373 | HAM 26.672 | LEC 26.356 | RUS 1:19.440 | PIA 1:19.436 |
| ... | ... | ... | ... | ... |
Chart View
Within the Chart view, users have the flexibility to select which sectors, lap times, or theoretical lap times to display. Additionally, there is an option to focus solely on Manufacturers. In the Manufacturer view, the fastest car from each Manufacturer will be highlighted for the specific plot.

Notes & Tips
- Tip: Use percentage and delta views to quickly identify which cars or drivers have the most efficient sector or lap times.
- Note: Chart view and manufacturer highlighting provide fast visual insights for both qualifying and race analysis.
Related Articles
- Car Selection Sidebar
- Time Loop Analysis Plugin
- Stint Analysis Plugin